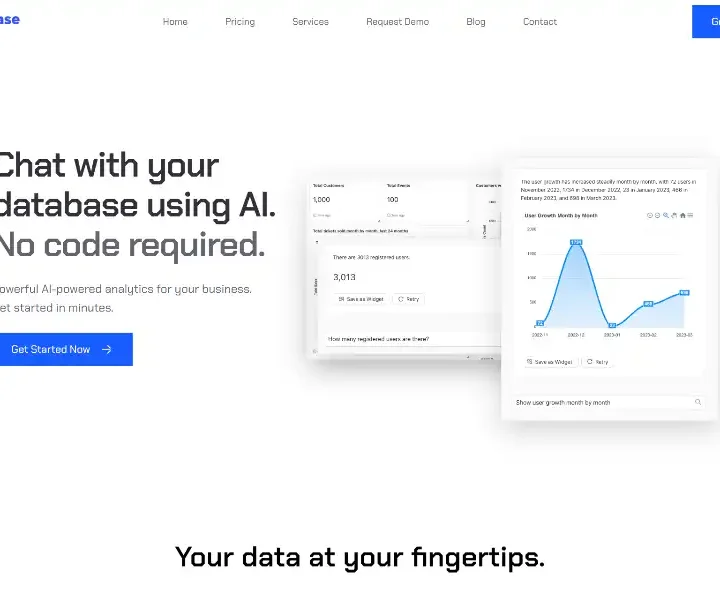
InsightBase markets itself as “Chat with your database using AI.” The core promise is threefold:
1. Plain-English Query Interface
Type “Which marketing channel had the highest LTV:CAC ratio last quarter?” and receive both the answer and a bar chart that can be pivoted by week, region or campaign.
2. Auto-Generated SQL & Explanations
Every visualization is accompanied by the underlying SQL and an English explanation so teams learn data conventions while consuming insights.
3. Dynamic Widget Parameters
Dashboard viewers can adjust filters on the fly—changing cohort size or churn definition—without editing SQL.
4. JavaScript & Custom Functions
Need to apply a proprietary churn model or currency conversion? Analysts can write JavaScript snippets that run server-side and integrate seamlessly into the conversational layer.
5. Embeddable Charts & iFrames
Customer-facing SaaS teams embed cohort-retention heatmaps inside their admin portal, reducing support tickets that ask for usage statistics.