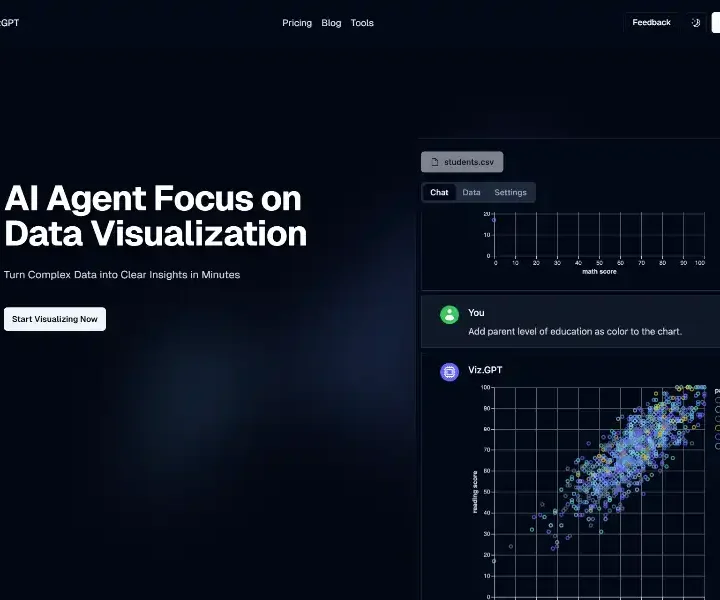
vizGPT is the fastest way to turn raw data into stunning, interactive charts—just ask in plain English. Powered by GPT-4 and a contextual memory engine, it understands follow-up questions, auto-profiles messy files, and renders million-row datasets in real time. Drag-and-drop or chat, share live links, and embed secure dashboards anywhere. Free to start, Pro at $29/month, SOC-2 ready.
Natural-Language Query Interface
Ask, “Show me revenue growth by region excluding outliers,” and vizGPT returns a box-plot layered over a choropleth map. Under the hood, the NLU layer detects the metric (revenue), the transformation (YoY growth), the grouping (region), and the filter (exclude outliers >3 SD). The user can refine with follow-ups like “Now break it down by product tier,” leveraging the conversation memory to inherit prior filters.
Drag-and-Drop GUI
For users who prefer tactile control, the left-hand shelf lists variables, transformations, and aesthetics. Dragging “Customer Lifetime Value” onto the y-axis slot instantly rewrites the Vega spec, while the chat panel auto-generates the corresponding English description—perfect for learning or documentation.
Smart Data Profiler
vizGPT runs DuckDB-powered profiling on every CSV, JSON, or database connection. It infers data types, cardinality, and skew, then surfaces “Quick Charts” ranked by statistical significance. Users often discover hidden correlations before they even ask a question.
Real-Time Collaboration
Each chart is a live URL. Stakeholders can comment directly on data points; Slack and Teams integrations push notifications when underlying data refreshes. Permission layers respect row-level security via SQL-backed policies, so sensitive data never leaks.